Architecture overview of the app
Because the example app will cover the most common use case in the Industrial Edge environment, the app on the Industrial Edge device will look like the architecture overview in the figure Example app architecture overview on Industrial Edge device. The purpose of the app is to collect, process and store data from an OPC UA server, which receives data from a PLC.

The app is divided into three sections: data collection from the OPC UA server by system apps, data distribution via the Databus, and data processing, storage and visualization in the Edge app.
Introduction to various components
-
The Databus based on MQTT is responsible for distributing data about certain topics that are populated by system apps or custom apps by publishing and subscribing to these topics.
-
OPC UA Connector connectivity is used to receive the data from the OPC UA server, which is providing data from a PLC. OPC UA Connector is a system app that publishes the data to the Databus. Another system app, the SIMATIC Flow Creator, consumes the data from the OPC UA Connector topics on the Databus. The data is preprocessed in the SIMATIC Flow Creator before being published on the Databus again.
-
The data analytics container developed with Python consumes the preprocessed data on the topics from the SIMATIC Flow Creator. Calculations and evaluations are then performed using Python data analytics and the results are returned as KPIs back to the Databus. To handle the Databus publishes and subscriptions, the data analytics container requires a MQTT client.
-
The SIMATIC Flow Creator consumes the analyzed data again. The SIMATIC Flow Creator persistently stores the (raw) and analyzed data in InfluxDB.
-
The InfluxDB is a time series database which is optimized for fast, high-availability storage and retrieval of time series data. It stores both the data transmitted by the OPC UA server to the app and the analyzed data.
-
The data stored in the database can be queried and graphed in dashboards to format and present it in a meaningful, understandable way. There are many types of dashboard to choose from, including those that come with InfluxDB or other open source projects such as Grafana. In this application, the native InfluxDB Dashboards are used for basic data visualization.
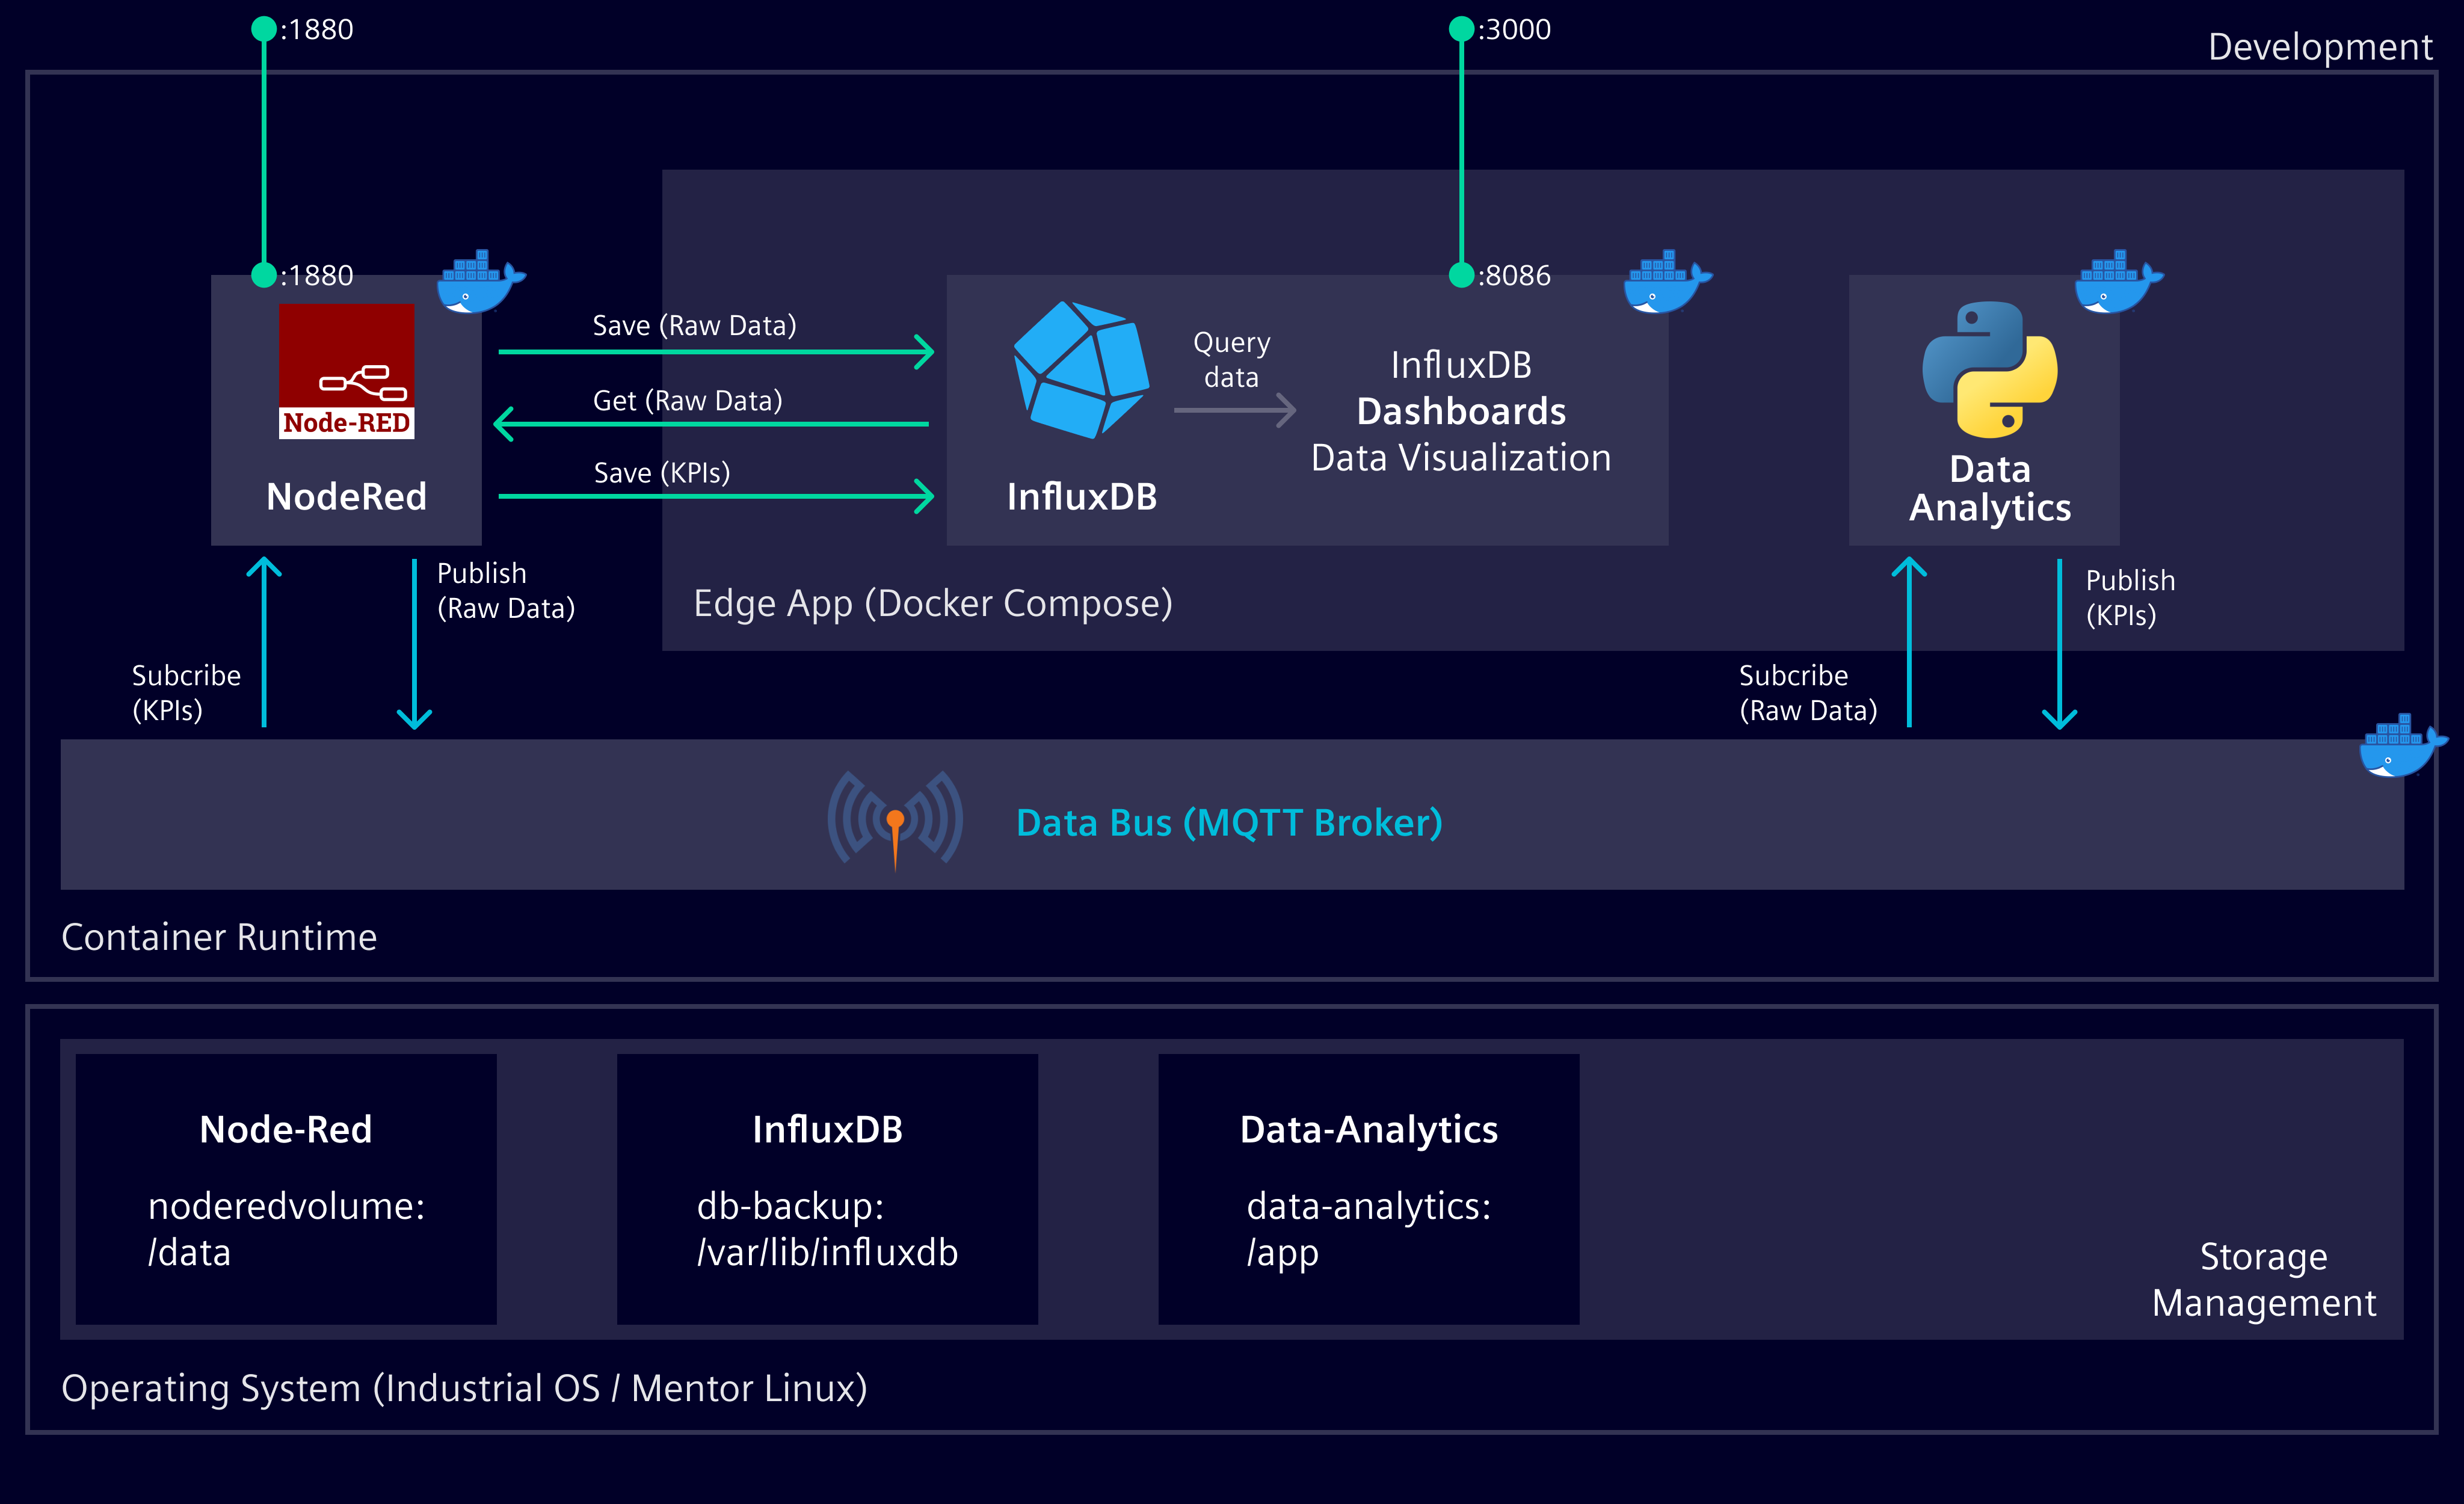
The system apps provided by the Industrial Edge cannot be used on the development machine. For testing purposes in the development environment, the architecture of the app looks slightly different as shown in the figure Example app architecture overview of development environment.

To simulate the behavior of the Databus, a standard MQTT broker will be used in its place. The OPC UA Connector and Flow Creator are replaced by a Node-RED container. Node-RED will create some dummy data, which simulates the OPC UA data being received by the OPC UA Connector and preprocessed for distribution for the data analytics container. The Node-RED container also performs the task of writing data to the database.